

Data, Maps, and Insight for Civic Impact
Turning complex data into civic impact.
Based in California, I partner with governments, nonprofits, and community organizations across the nation. I specialize in transforming raw datasets into clear analysis, interactive maps, and actionable insights that drive policy and strengthen democracy.
Whether you’re a policymaker, advocate, researcher, or community leader, I don’t just deliver numbers – I help your data tell a story. I bring experience in statistical analysis, GIS mapping, and public policy research to every project, tailoring my support to the unique needs of your mission and community.
Services
Data Analysis
- Data pipelines built for you that keep your information clean, organized, and ready for immediate use.
- Clear, decision-ready summaries that translates data into practical actions and policy.
Mapping & GIS
- Interactive web maps built with open source software so your audience can explore data visually.
- Census and ACS demographic overlays to reveal patterns and community trends.
- Redistricting and boundary analysis to support planning, compliance, and equity goals.
Policy Research
- Memo-ready findings and visuals that decision makers can use immediately.
- Plain-language briefs and one-pagers to communicate complex topics clearly.
- Presentation support for boards and meetings to ensure data drives discussion and action.
Highlighted Projects
Community
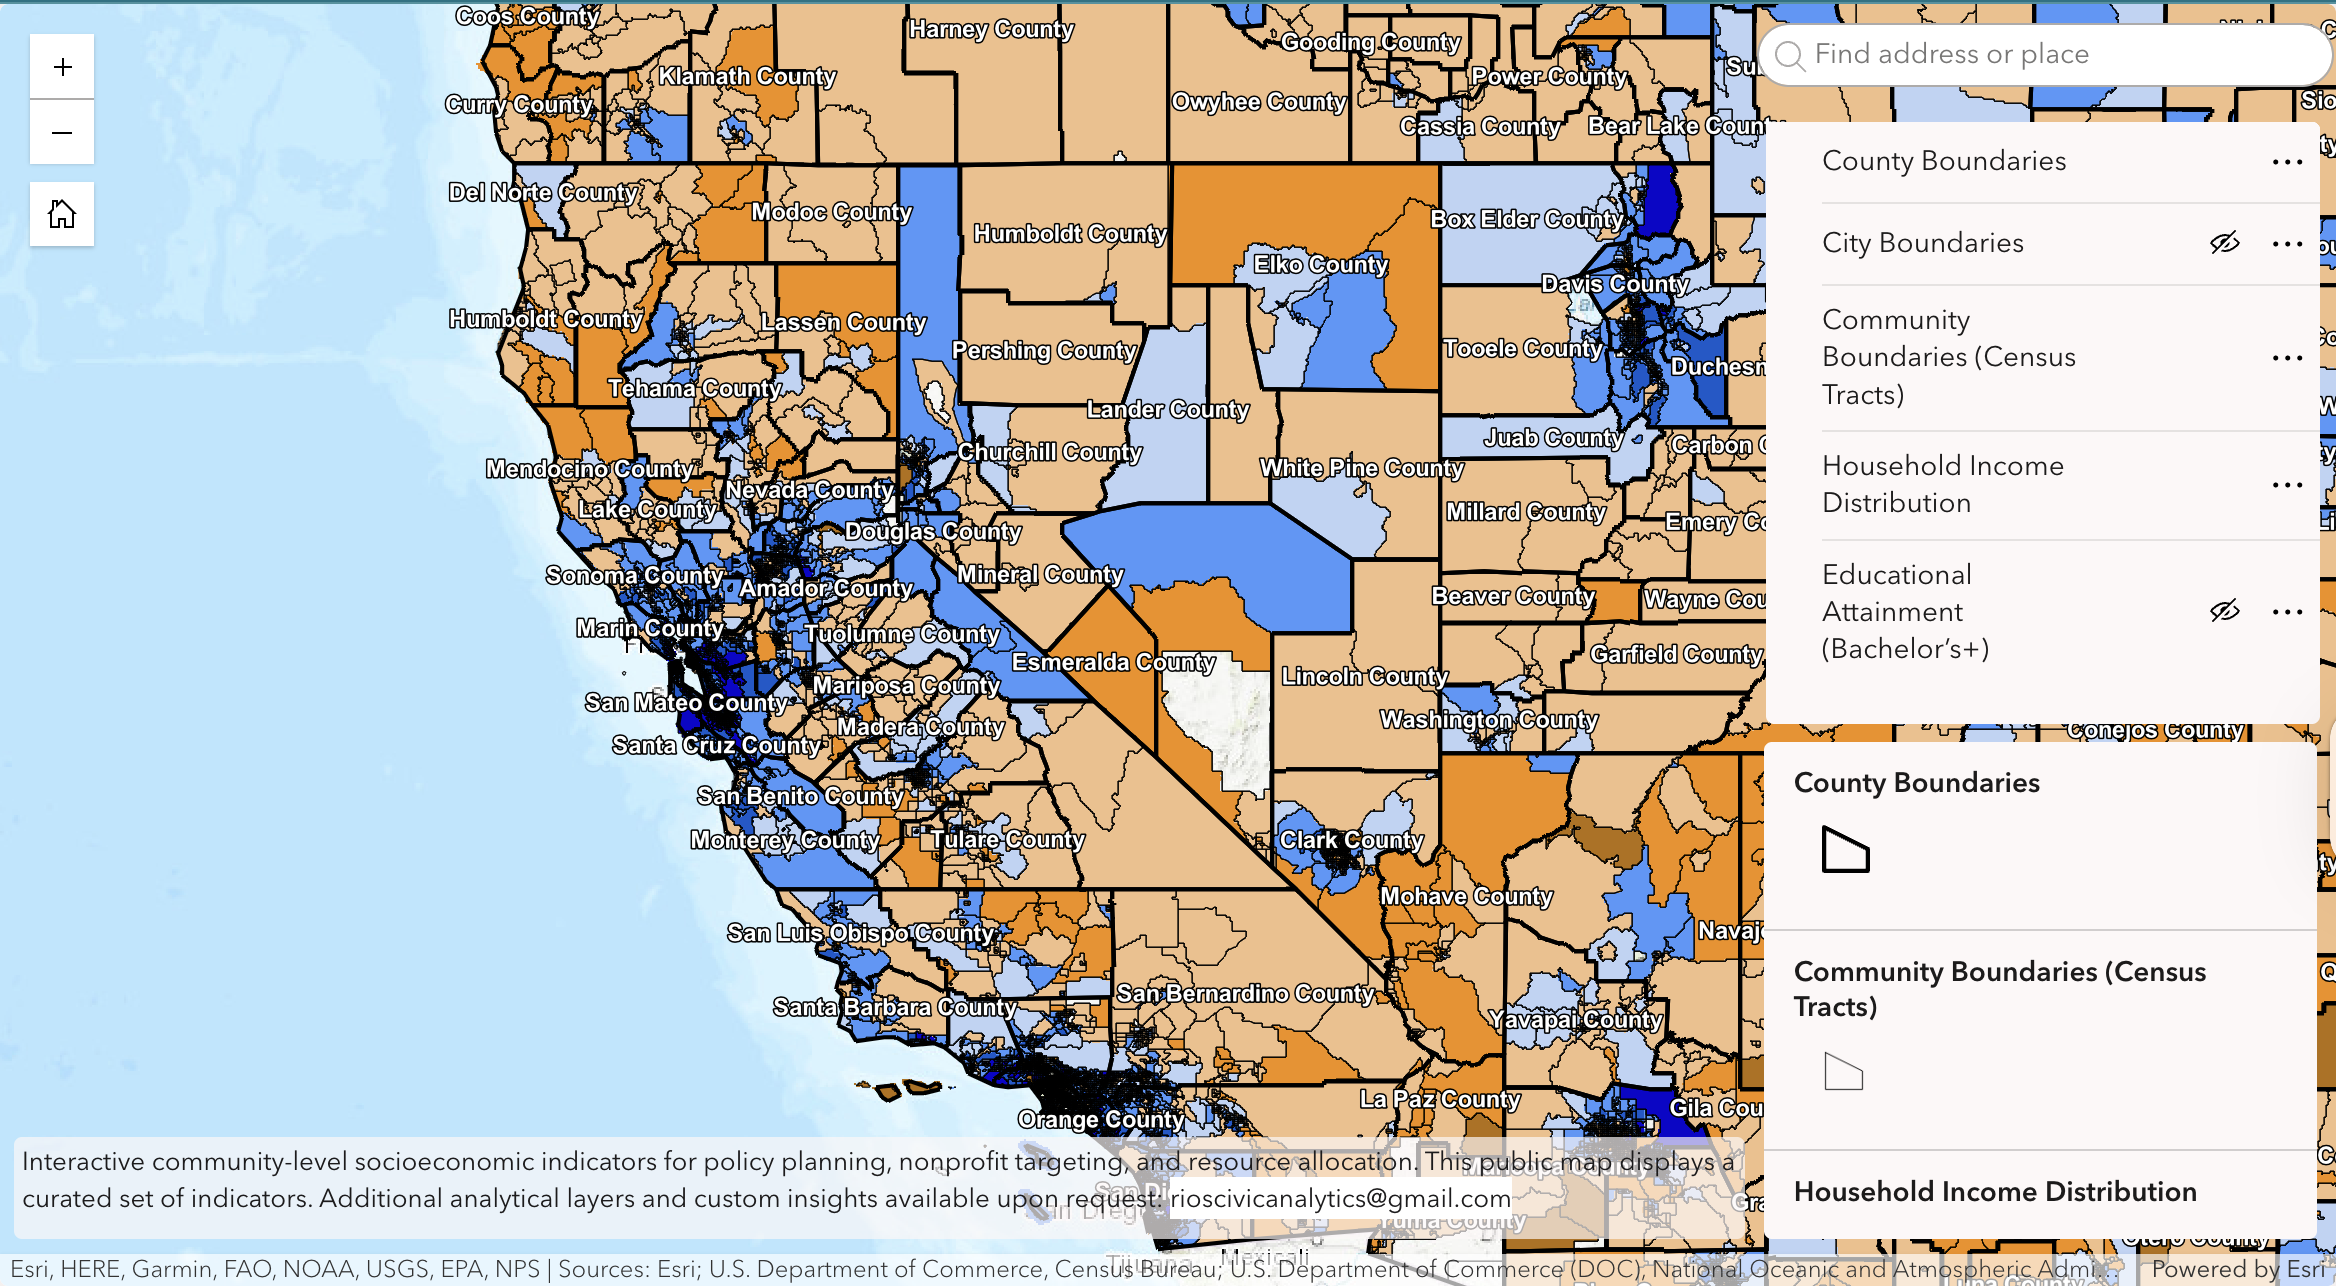
Mapping Explorer
Built by Michael Rios, the Civic Data Explorer helps municipalities quickly understand community make-up and neighborhood differences. With side-by-side and layer toggles, users can compare key indicators – such as median income, number of housing units, median age of housing, homeownership, and population with health insurance – turning complex Census tables into clear, easy-to-use visuals.
Contact me to explore the full map. The full version includes additional indicators such as educational attainment, workforce patterns, and demographic context.
Let’s Work Together
Form below – or email rioscivicanalytics@gmail.com / text (909) 465‑3947.


What’s different about my work
How I work: brief scoping → rapid draft → collaborative feedback → final hand-off with documentation and deliverables.
Clear, useful, done.
- Nonpartisan & vendor‑neutral. I help governments and nonprofits make defensible decisions – no political spin, no software upsell.
- Open, reproducible work. Clean code, clear methods, and documented assumptions – so your team can audit, reuse, and maintain.
- No lock‑in. I deliver in open formats (CSV/SHP/GeoJSON) and common tools (R/Python/ArcGIS). You keep everything.
- Descriptive stats, clearly explained. I turn raw data into plain‑English summaries, equity‑focused indicators, and visuals people actually use.
- From maps to messages. I go beyond analysis, creating one-pagers, visualizations, and simple dashboards your communications team can own.
- Data hygiene first. I capture and clean data, apply consistent methodology, and maintain detailed records, with built-in checks to catch and correct issues before they affect results.
- Data privacy guaranteed. Transparent methods, validation steps, and careful handling of sensitive data.
